Language:


The indicators aim at monitoring the long-term performance
of the chlor-alkali industry. The companies of the sector
continue to reaffirm their goal of promoting growth without
losing sight of social-environmental performance and their
commitment to sustainability.
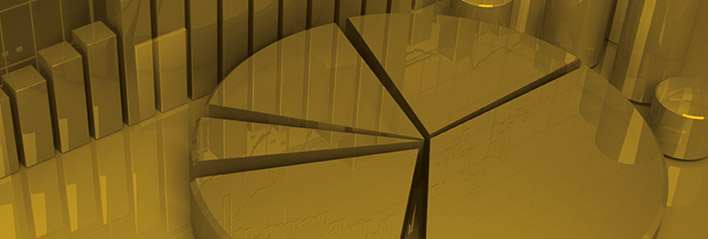
1. Companies in the sector : industrial technologies and
installed capacity
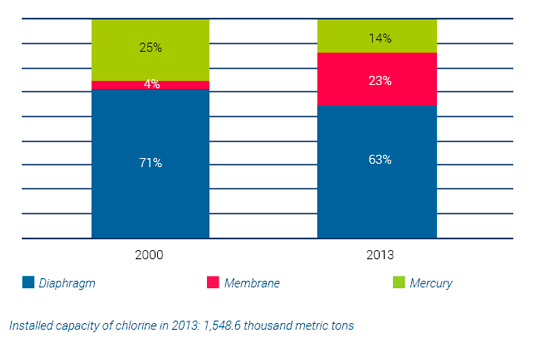
Chlorine and caustic soda or caustic potash are produced
by electrolysis using three main industrial technologies:
mercury cells, diaphragm cells and membrane cells. In 2013,
Diaphragm technology maintained the lead (accounting for
63% of the installed capacity, of which 9% used diaphragm
without asbestos and 54% with chrysotile), followed by
Membrane technology (23% of installed capacity) and
Mercury technology (14% of installed capacity).
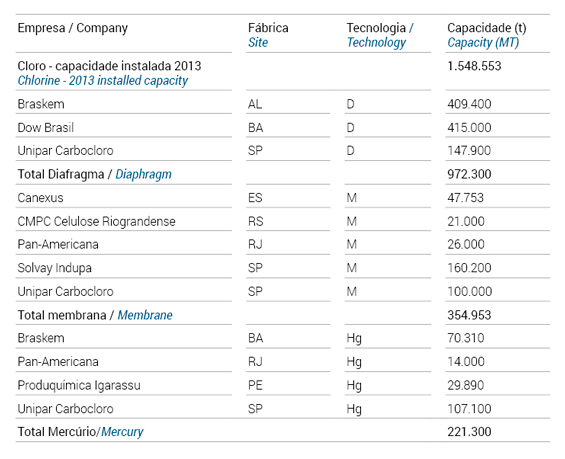
Installed capacity of chlorine by process
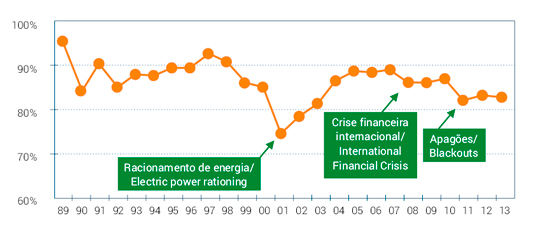
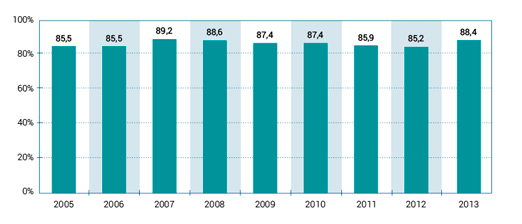
2. Capacity utilization level
Currently the installed capacity of chlorine is 1,548.6
thousand tons/year and for caustic soda 1,689.8thousand
tons/year. Over the 12 months in 2013, the average rate of
installed capacity utilization was 83%, with the highest rate
occurring in the month of July: 88.2%.
Under normal conditions, the industry operates with rates
above 87%. Over the past three years, the average annual
capacity utilization was hindered by problems in electric
power supply (blackouts).
Average rate of capacity utilization (chlorine basis)
3. Chlorine and Soda - main applications
The productive chain of chlorine and caustic soda begins
with the electrolysis of sodium chloride or potassium chloride
brine. In this process, besides chlorine and caustic soda
(sodium hydroxide) or caustic potash (potassium hydroxide),
hydrogen, hydrochloric acid and sodium hypochlorite are
also produced.
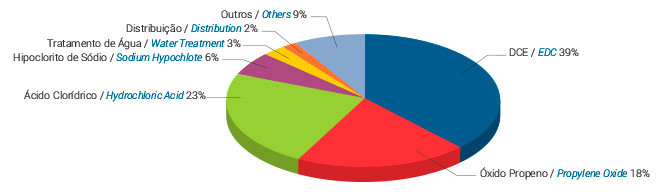
The applications of chlorine are very diversified: chlorine
is present in the production of 60% of all chemicals
products of relevant commercial importance and 85% of
the pharmaceutical products. To illustrate the diversity of
economic sectors where chlorine is present in the production
process, we mention the following: DCE - dichloroethane (raw
material used to manufacture PVC resins), propene oxide
(used to produce foams for manufacturing mattresses and
upholstery), hydrochloric acid, sodium hypochlorite, water
treatment, pharmaceuticals and pesticides, among others.
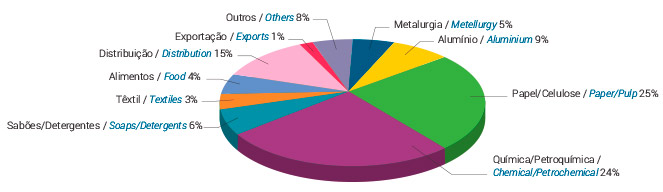
The applications of soda are also considerably diversified,
among which the following stand out: pulp & paper,
chemical & petrochemical, metallurgy (production of
alumina for the aluminum industry), soaps & detergents,
textile industry and food.
The charts below show the behavior of chlorine and caustic
soda consumption in 2013, by segment:
Caustic soda - 2013 market segmentation of domestic production
Chlorine - 2013 Market segmentation of domestic production
4. Total sales/taxes
A significant part of the income generated by the chlor-alkali
industry is transferred to the government in the way of taxes
and social contributions.
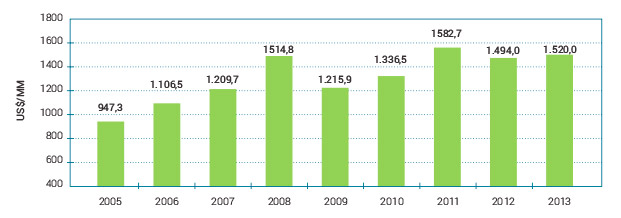
The charts below show the evolution of net sales and taxes
generated by the industry in the past years.
Net sales of the chlor-alkali industry
Taxes generated

5. Inputs: electric power and salt or rock salt
Electric power is the main input in the chlor-alkali industry,
which is known to be electro-intensive, and its share in the
total production cost adds to around 45%. Consequently, the
chlor-alkali industry depends on securing power supply at a
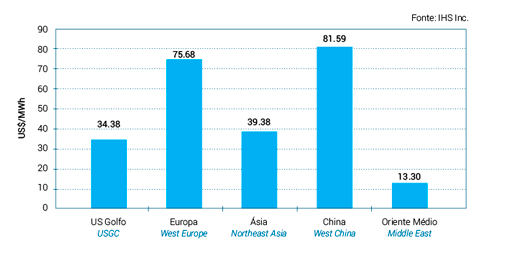
competitive cost. The high price of electric power in Brazil
has compromised the industry’s competitiveness.
The chart below shows the price of electricity at an
international level:
Price of electric power for the chlor-alkali industry - international level - 2013
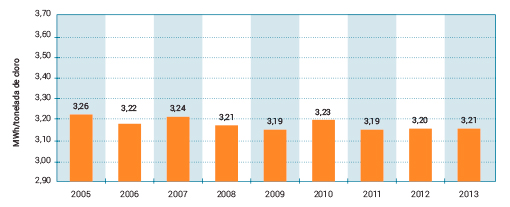
In 2013, to produce 1,247.9 thousand tons of chlorine,
4,005.7 GWh of electric power were used, equivalent to 3,2
MWh per ton of chlorine produced.
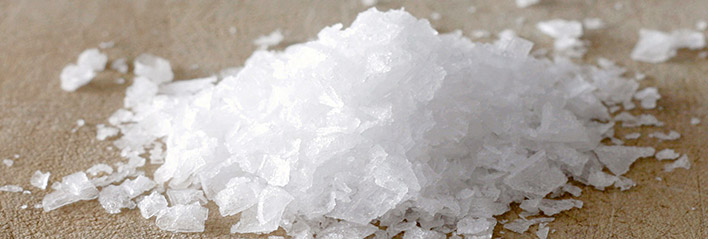
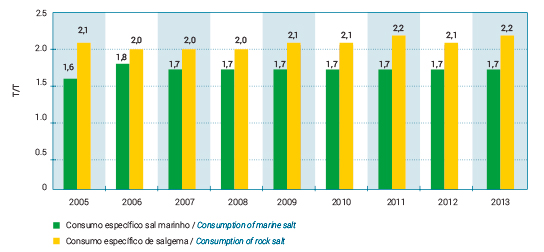
The other key input used in the chlor-alkali industry is salt,
which can be of marine origin or rock salt.In 2013, the
industry’s production used 2,381.4 thousand tons of salt:
61% coming from mines (rock salt), corresponding to a
specifi c consumption of 2.2; and 39% from the sea (marine
origin), with a specifi c consumption of 1.7.
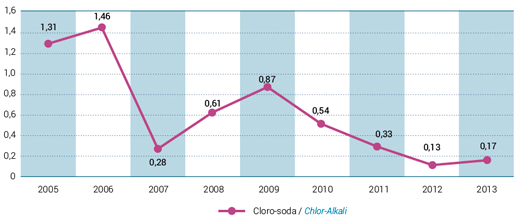
The charts below show the evolution of the specifi c
consumption of energy (MWh per t
Eletric power - specifi c consumption (chlorine basis)
Marine salt and rock salt - specif consumption
6. Hydrogen
The hydrogen gas generated during the electrolysis process
as a co-product of chlorine and soda is of high quality and
can be used both as a raw material and as fuel to generate
process steam. The industry has been using this gas at
levels superior to 80%, which is considered a good indicator.
Hydrogen used (%)
7. Safety, health and the environment
Safety at work is a constant concern for the chlor-alkali
industry, which has been investing intensively to prevent
incidents and accidents. This concern applies to the
industries own employees and contracted parties alike,
who adopt the same safety and protection policies, without
distinction.
The safety and updating of productive processes follow the
same lines. Aimed at reducing incidents or production losses
and improving competitiveness, the industry pursues the
best market practices, adopting the technological advances
available in terms of prevention in favor of the environment,
safety and occupational health.
The chart below shows the frequency of accidents with
leave of absence in the chlor-alkali industry. In 2011, the
increased number of events occurring in production units
has raised this indicator expressively. The industry has been
working exhaustively on the prevention of such incidents/
accidents through training, inspections and motivation of
its employees aimed at improving this indicator, and a trend
of reduced accidents can already be observed in 2012 and
2013.
Frequency of accidents resulting in leaves of absence in the chlor-alkali industry
Own employees and contracted personnel (per million hours worked)
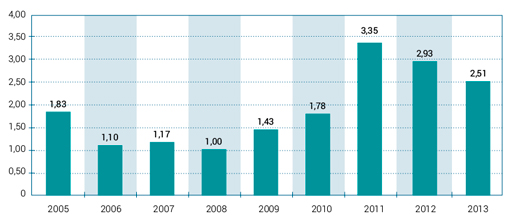
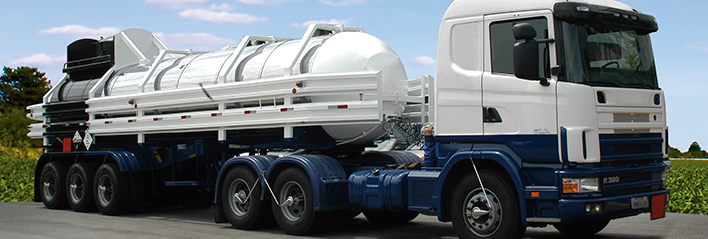
8. Safety in transportation of products from the chlor-alkali industry
For 17 years, Abiclor has promoted the annual meeting of transportation companies where the best techniques and practices for safe transportation of the industry’s products are discussed.
The indicator below shows the effort that companies in the industry have made to reduce accidents in the transportation of chlorine, soda and derivatives in recent years. In recent years, the sector has considerably reduced the frequency rate of accidents.
Frequency of accidents per 10,000 trips
Annual Report 2014